 订阅
订阅Matlab常用函数——plot3函数
来源:网络收集 点击: 时间:2024-02-29【导读】:
Matlab的强大之处就在于其提供的很多基础函数,可以方便解决很多问题,本经验将讲解一些常用的Matlab函数。工具/原料moreMatlab方法/步骤1/6分步阅读 2/6
2/6 3/6
3/6 4/6
4/6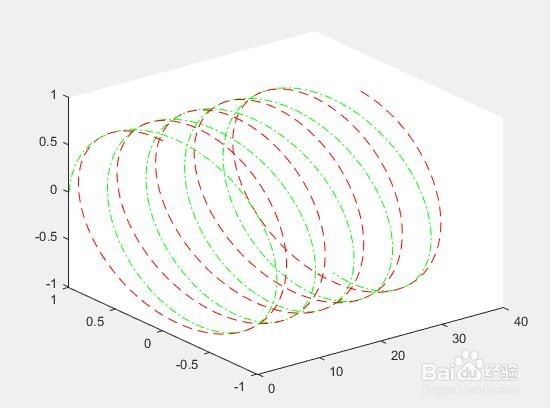 5/6
5/6 6/6
6/6
plot3函数,用于绘制3D图形的一个非常常用的函数。有多种格式,下面将给出一般的使用规范。
2/6第一个例子:
t = 0:pi/50:10*pi;
st = sin(t);
ct = cos(t);
figure
plot3(st,ct,t)
3/6第二个例子,同时画两个图plot3(x1y1,z1,x2,y2,z2)
t = 0:pi/50:10*pi;
st = sin(t);
ct = cos(t);
x=0:0.1:30;
y=cos(x);
z=sin(x);
plot3(t,st,ct,x,y,z)
4/6更改线性,颜色
t = 0:pi/50:10*pi;
st = sin(t);
ct = cos(t);
x=0:0.1:30;
y=cos(x);
z=sin(x);
plot3(t,st,ct,--r,x,y,z,-.g)
5/6有返回值的情况
t = 0:pi/50:10*pi;
st = sin(t);
ct = cos(t);
h=plot3(t,st,ct);
h.LineStyle = --;
通过这种方式设置线型
6/6设置线宽
t = 0:pi/50:10*pi;
st = sin(t);
ct = cos(t);
h=plot3(t,st,ct);
h.LineWidth =2;
版权声明:
1、本文系转载,版权归原作者所有,旨在传递信息,不代表看本站的观点和立场。
2、本站仅提供信息发布平台,不承担相关法律责任。
3、若侵犯您的版权或隐私,请联系本站管理员删除。
4、文章链接:http://www.1haoku.cn/art_176024.html
上一篇:牛肉嫩滑不柴不硬的家常做法
下一篇:喝酒时吹牛的游戏规则是什么