 订阅
订阅三维图形的绘制
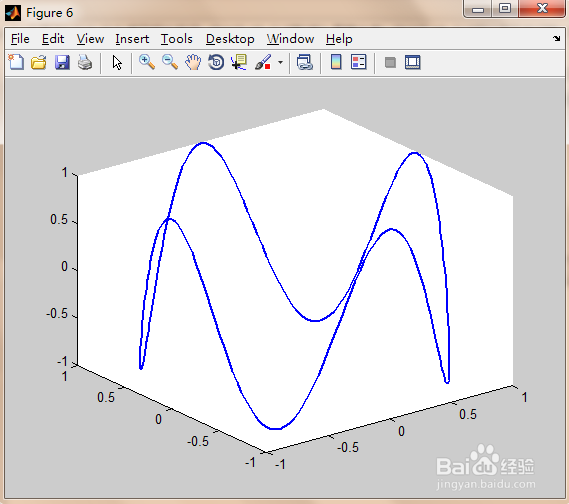
来源:网络收集 点击: 时间:2024-03-01曲线图绘制:plot3指令使用示例
在命令窗口中输入以下代码:
theta = 0: 0.01*pi: 2*pi;
x = sin(theta);
y = cos(theta);
z = cos(4*theta);
figure
运行结果如下:
 2/7
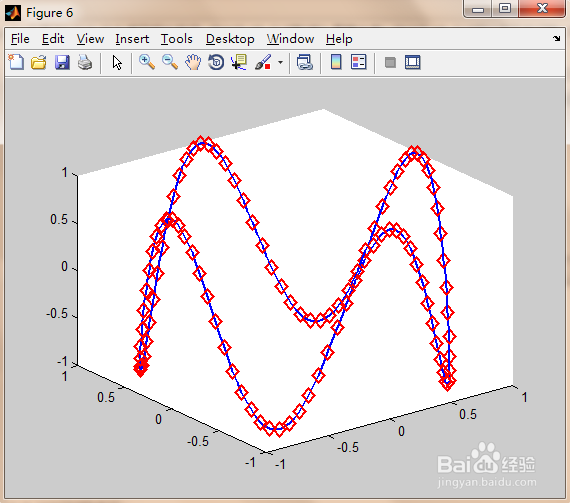
2/7theta = 0: 0.02*pi: 2*pi;
x = sin(theta);
y = cos(theta);
z = cos(4*theta);
plot3(x,y,z,rd,MarkerSize,10,LineWidth,2)
 3/7
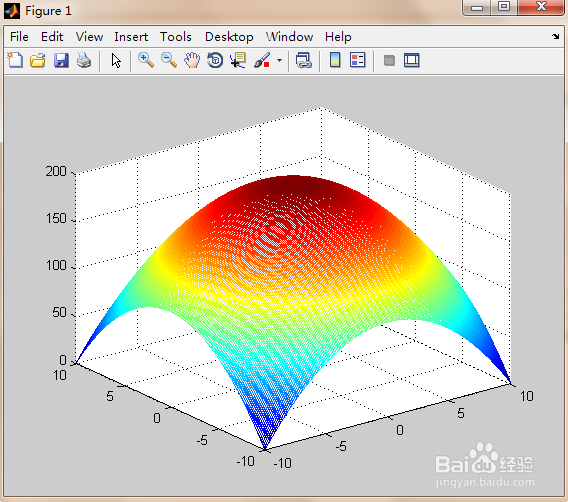
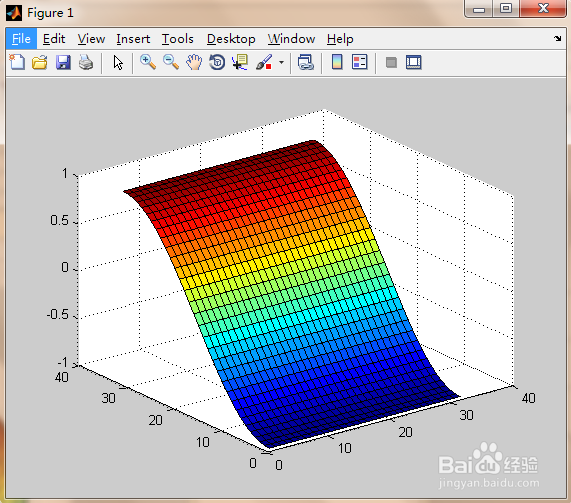
3/7网格图绘制
绘制三维网格图的过程如下:
(1)确定自变量x和y的取值范围间隔如下:
x = x1:dx:x2,y = y1:dy:y2
(2)构成xoy平面上的自变量采样“格点”矩阵:
法1:利用“格点”矩阵原理生成矩阵。
x = x1:dx:x2;y = y1:dy:y2;
X = ones(size(y))*x;
Y = y*ones(size(x));
法2:利用meshgrid指令生成“格点”矩阵。
x = x1:dx:x2;y = y1:dy:y2;
= meshgrid(x,y);
(3)计算在自变量采样“格点”上的函数值:Z=f(X,Y)。
代码如下:
X = -10:0.1:10;Y = -10:0.1:10;
= meshgrid(X,Y);
Z = -X.^2 - Y.^2 + 200;
mesh(X,Y,Z)
 4/7
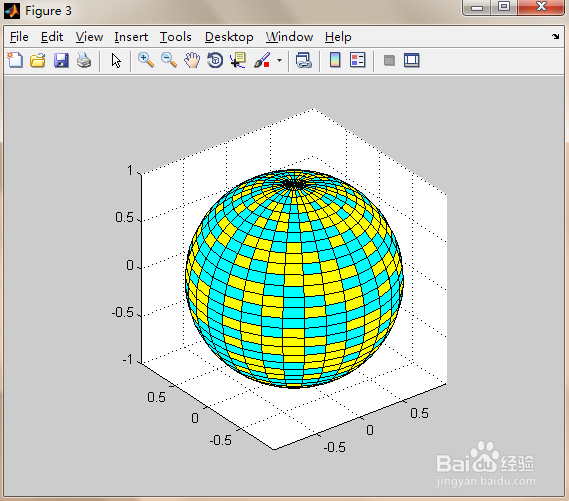
4/7曲面图的绘制:surf指令与mesh指令对比
代码如下:
k=5;
n=2^k-1;
=sphere(n);
c=hadamard(2^k);
figure(1)
surf(z);
figure(2)
surf(x,y,z);
axisequal
figure(3)
surf(x,y,z,c);
colormap()
axisequal
运行结果如下:

 5/7
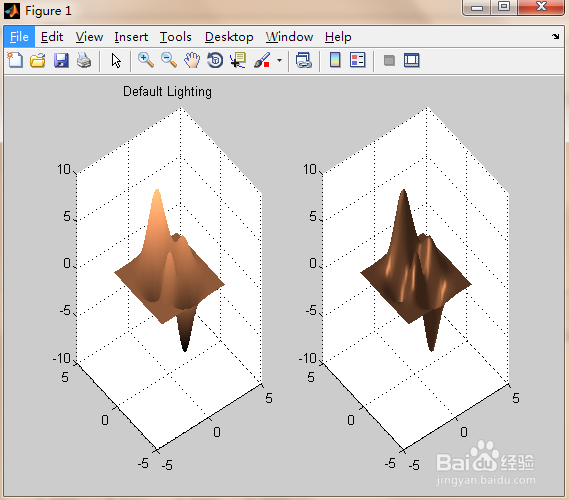
5/7光照模型:带光照的曲面图
代码如下:
= peaks(30);
subplot(1,2,1);
surf(X,Y,Z),colormap(copper),title(Default Lighting),shading interp
subplot(1,2,2);surfl(X,Y,Z,,),shading interp
运行结果如下图所示:
 6/7
6/7绘制等值线图:contour指令使用实例
代码如下:
= peaks(30);
figure;
subplot(2,2,1);contour(X,Y,Z);axis square
subplot(2,2,2);contour(X,Y,Z,10);axis square
subplot(2,2,3);contour(X,Y,Z,-10:1:10);axis square
subplot(2,2,4);contour(X,Y,Z,);axis square
运行结果如下:
 7/7
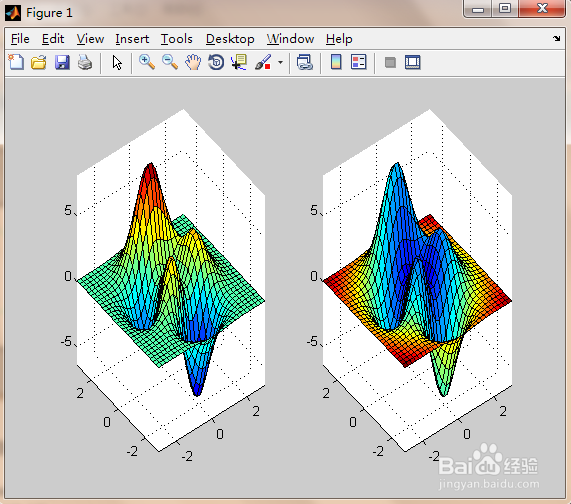
7/7用颜色描述第四维:
代码如下:
= peaks(30);
R = sqrt(X.^2+Y.^2);
subplot(1,2,1);surf(X,Y,Z,Z);
axis tight
subplot(1,2,2);surf(X,Y,Z,R);
axis tight
运行结果如下:
 软件
软件 版权声明:
1、本文系转载,版权归原作者所有,旨在传递信息,不代表看本站的观点和立场。
2、本站仅提供信息发布平台,不承担相关法律责任。
3、若侵犯您的版权或隐私,请联系本站管理员删除。
4、文章链接:http://www.1haoku.cn/art_192265.html