 订阅
订阅用matplotlib画极坐标图像
来源:网络收集 点击: 时间:2024-05-04绘制极坐标图像:
import matplotlib.pyplot as plt
import numpy as np
a = plt.subplot(121, projection=polar)
b = plt.subplot(122, projection=polar)
t=np.linspace(0,2*np.pi,30) #采样
a.plot(t,np.sin(3*t),.,c=g,)
b.plot(t,np.sin(3*t),-,c=r,)
plt.show()
 2/12
2/12增加采样数:
t=np.linspace(0,2*np.pi,60)
 3/12
3/12一般的,采样数越大,曲线看起来越光滑:
import matplotlib.pyplot as plt
import numpy as np
for n in range(30,101,5):
a = plt.subplot(121, projection=polar)
b = plt.subplot(122, projection=polar)
t=np.linspace(0,2*np.pi,n)
a.plot(t,np.sin(3*t),.,c=g,)
b.plot(t,np.sin(3*t),-,c=r,)
plt.savefig(str(n)+.png,dpi=100)
plt.show()
 4/12
4/12第二幅图的线条变细:
b.plot(t,np.sin(3*t),-,c=r,lw=0.5)
 5/12
5/12用虚线绘制图像:
b.plot(t,np.sin(3*t),--,c=r,lw=1)
 6/12
6/12用虚线和点交替绘制图像:
b.plot(t,np.sin(3*t),-.,c=r,lw=1)
 7/12
7/12用像素点画图:
b.plot(t,np.sin(3*t),,,c=b,)
 8/12
8/12用三角形代替点:
b.plot(t,np.sin(3*t),^,c=b,)
 9/12
9/12用三尖形代替点:
b.plot(t,np.sin(3*t),1,c=b,)
 10/12
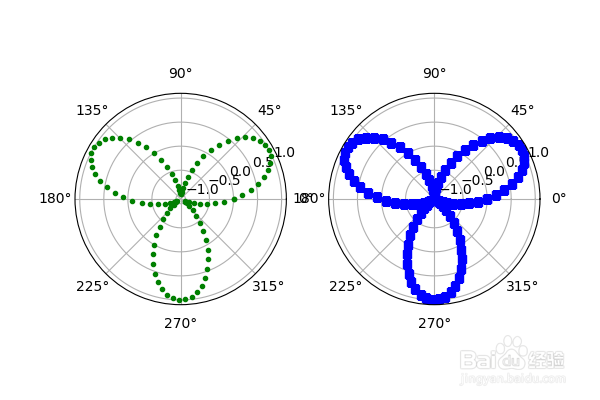
10/12用正方形代替点:
b.plot(t,np.sin(3*t),s,c=b,)
 11/12
11/12用平行四边形代替点:
b.plot(t,np.sin(3*t),d,c=b,)
 12/12
12/12用短线代替点:
b.plot(t,np.sin(3*t),_,c=b,)
 PYTHON极坐标MATPLOTLIB
 版权声明:
1、本文系转载,版权归原作者所有,旨在传递信息,不代表看本站的观点和立场。
2、本站仅提供信息发布平台,不承担相关法律责任。
3、若侵犯您的版权或隐私,请联系本站管理员删除。
4、文章链接:http://www.1haoku.cn/art_670524.html